Jira’s reporting capabilities are super powerful! There are many ways to view, present, and share issue data and progress. Here’s a high-level view of the options and when to use each.
| Method | Description | Jira Type | Best For |
| Summary | A high level project overview Read more | Jira Cloud business projects and Data Center business and software projects | Quick statistics |
| Filter | A saved search result Read more | All | Reusable issue list with customizable scope and columns |
| Filter subscription | Search results by email Read more | All | Reusable issue list emailed on a custom schedule |
| Queue | A shared view of issues Read more | Jira Service Management | Sharing requests with support team members |
| List | A spreadsheet-like view Read more | Jira Cloud and with the “Filter results” dashboard gadget in all types | Sorting, grouping, and filtering issues |
| Calendar | A date-based view Read more | Jira Cloud and with the “Jira issues calendar” dashboard gadget in all types | Viewing issues by date |
| Timeline | A single-project planning tool Read more | Jira Cloud | Visualizing plans and dependencies |
| Roadmap (plan) | A cross-project planning tool Read more | Jira Cloud Premium and Enterprise | Advanced planning and timeline features |
| Expandable issue hierarchy | Visualize relationships between issue types Read more | Jira Cloud Premium and Enterprise or with an app in all types | Organizing parent and child issues |
| Report | Built-in views for common metrics Read more | All | Quick, real-time insights |
| Board | A status-based view Read more | All | Viewing issues in columns |
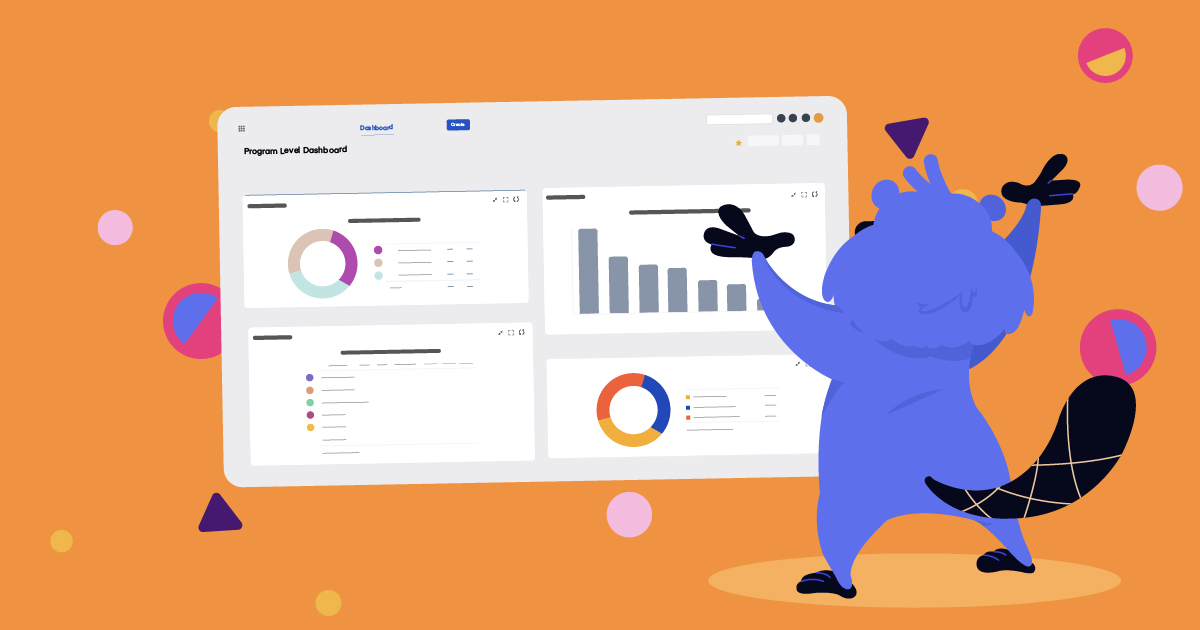
| Dashboard | A statistics-based view Read more | All | Viewing issues as graphs, counts, trends, and charts |
| Marketplace app | Third-party add-ons and integrations See options | All | Adding additional capabilities |
As you can see, Jira provides multiple ways to view data in many different formats. For whatever reason, boards seem to get all the love and attention! Boards are great for showing current issue status, but when you need to understand statistics, use a dashboard instead.
Check out my article on Salto’s website for dashboard examples and how to build them.

Read: Jira Dashboard Examples for Better Data Insights
Create custom dashboards to show a high-level overview or a snapshot of progress over time.
